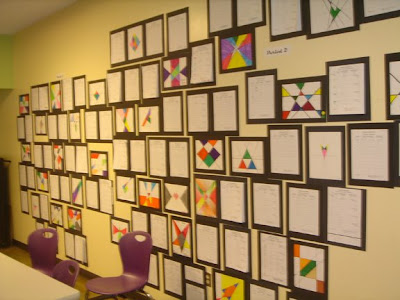
We just completed a project in Algebra 2. Each student designed a picture made up only of lines and shaded regions. They had to then determine the equations of the boundary lines and the systems of inequalities that described each region. The drawings and equations/inequalities were all displayed today; to finish the assignment, each student had to pick someone else's project, copy down their inequalities, graph it, and see if they got the same picture.
Graphing systems of inequalities is always a challenging topic for my students; this project underscored just how difficult the topic is, as most students needed repeated explanations and examples, just to figure out what they were supposed to do. Though it took longer than expected (and time budgeted), it seems to have been worth the time. Ideally, this should be followed up by a linear programming unit, but we don't have the time this year. Here are some pictures:
And, a bonus picture from a few weeks back... each year we have a spirit week in April, and part of it is class competitions. Here is our media center all decked out for the event.
Thinking Thursday: Gadgets Galore
12 hours ago


6 comments:
I am intrigued with the idea of the Algebra II Exhibition.
Did your students use calculators to help them with their initial work or the "check" that they made of another's project?
Thanks - Richard
Hi Richard,
No, they didn't use graphing calculators, if that's what you mean. Whether or not they used regular calculators to deal with arithmetic, I don't know, as they did most of the work at home (they don't have graphing calculators, so that's how I know they didn't use them!). But the math was not that complicated - once they had their designs, it was just a question of coming up with linear equations. We specified that all lines should have both a y- and an x-intercept showing on the plane, so that it would be simpler to come up with both slope-intercept and standard form equations.
And for checking each other's projects, we just had them pick a couple of regions and graph the system of inequalities that the student had written to see if it matched - not the whole picture, as that would have taken too long.
Let me know if you want more information on the project.
I happened to come across your blog today when I was looking for some real world examples of exponential curves.
This blog is totally brilliant!
If I'd had you as a teacher, I am confident I would have mastered calculus, instead of abandoning math.
Wishing you well on your mission!
Hi Susan,
Thanks - I appreciate it. I plan on getting back to regular posting once the new school year gets going.
Did you find any good real world examples of exponential functions? Bacteria growth, radioactive decay, and savings accounts get a bit tiresome...
I found a couple of examples. The one that would probably be most engaging to your students is related to advancements in computer technology.
http://www.kurzweilai.net/meme/frame.html?main=/articles/art0593.html There are several examples on this page.
I didn't include these in my own article (www.customercrossroads.com), but I did make reference to Moore's law.
I am a math teacher in the DE area. Do you have the handout and rubric you used for the project? I would love to see if it fits for my Alg 2 class.
Post a Comment