In this lesson, I will take the class to our computer lab so we can work with the OS X Grapher application. This is the program I've been using to generate all the 2D graphs I give them on worksheets. It can do 3D graphs as well, with nice lighting and rotation. You can even graph implicit functions and relations - I like plugging in random equations to see what kinds of shapes it can make.
We'll start by looking at the 3 axes and see what the planes x, y, and z = 0 look like, as well plotting an ordered triple.
Then, I'll show them what the graph of ax + by + cz = d looks like, and how three planes can intersect at a single point (this being the solution to a 3x3 system of equations).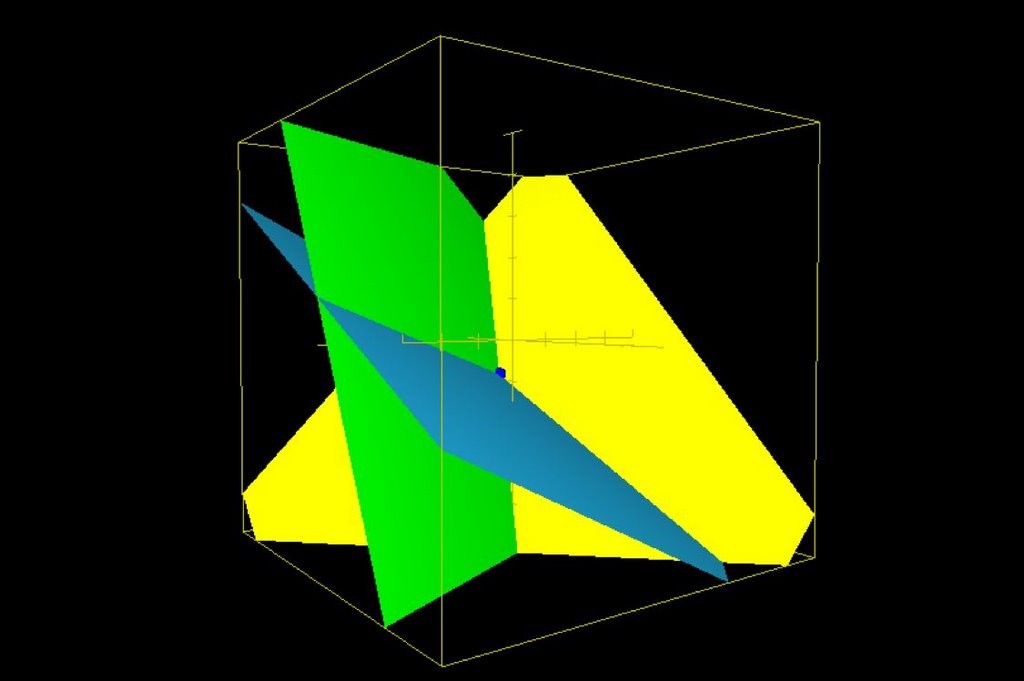
We'll also look at systems with no solution (i.e. at least two of the planes are parallel) or an infinite number of solutions (all three intersect at the same line).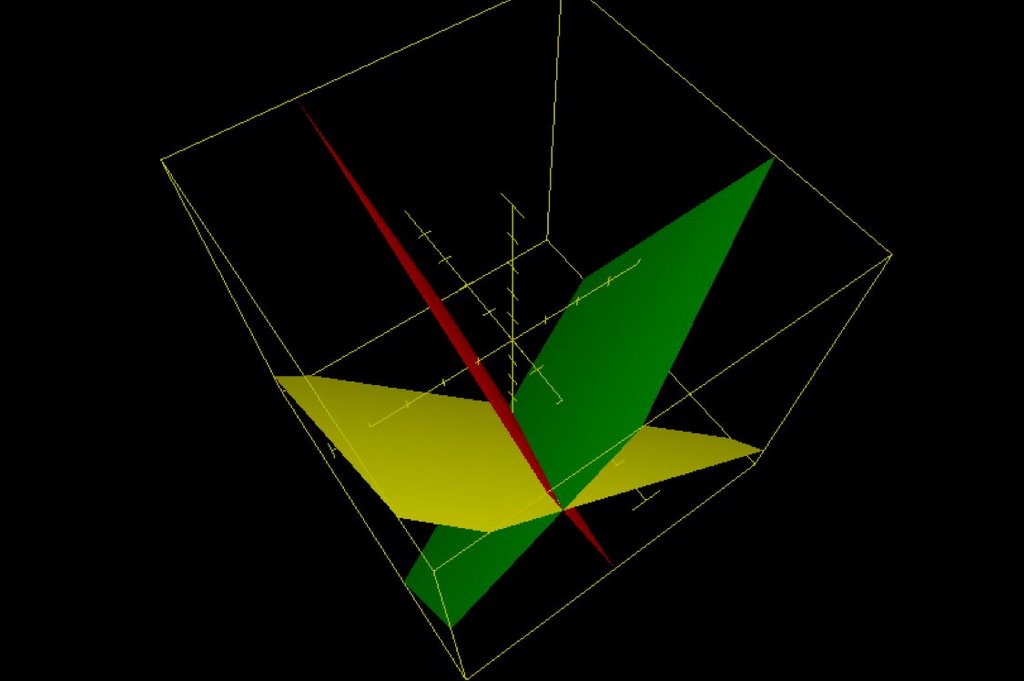
I think that seeing this will help them visualize 3D graphing much better than me trying to draw it on the board.
During the demonstration, I will be teaching them how to enter functions in to Grapher. After the demonstration, I will put two 3x3 systems on the board. One has a solution and the other doesn't. They must first decide which does by graphing both and determining which has a point of intersection. Once they decide, they must solve the system algebraically, and then plot the solution to see if it falls on the point of intersection of the planes.
After this, we'll go medium-tech (i.e. just using their TIs). I will show them how to use the "stat plot" feature, and we will plot the points (-1, -10), (1, -18), and (5, 14). I will ask them if they can figure out the function of the parabola that passes through those three points. I don't expect them to be able to figure this out on their own, so I will lead them through plugging in the points into the standard form of a quadratic function, which will generate a 3x3 system of equations. We'll solve this together to find that a = 2, b = -4, and c = -16. Graphing the parabola y = 2x^2 - 4x - 16 will confirm the work.
Hopefully there will be time for them to try this on their own as practice. I'll ask them to find the function of the parabola that passes through (-2, 0), (-1, -6), and (3, -10). This is definitely a lot for one lesson, and I've never done this before (our lab is new!), so I'll have to see how it goes.

Thinking Thursday: Triangular Numbers
1 day ago

 ?
?

3 comments:
Nice! How did it go?
It went well for some students, and less well for others. The students really liked Grapher - the major problem was trying to stop some of them from trying out all sorts of things, changing the colors, etc, and refocus on the lesson. At the same time, I know it's natural to play with software like that, and that sometimes you can learn more in 10 minutes of fiddling than in an hour of direct instruction.
So for the students who were able to stop changing the colors and patterns, they were able to determine which system had a solution, solve it (though some of the students were still having trouble with the algebra), and plot the point. But I think everyone did get a better understanding of what they are doing when they solve a 3x3 system.
The second part of the lesson got kind of ruined. I needed to go borrow an overhead projector from another room as the lab doesn't have one, to use my overhead TI (I can't find a Mac emulator for TI-83+). I forgot to get it ahead of time, so I had to run and grab one. Then, the bulb burned out and the backup was also dead. I had a student go to the front to get another bulb, which ate another 5 minutes. Essentially, the TI part of the lesson didn't fly. Oh well, I'll try that again another time.
Dan, I recently found the following emulation software from TI:
http://education.ti.com/educationportal/sites/
US/productDetail/us_smartview.html?bid=1
It runs on MacOS X (later versions). I just ordered it and I'm interested to see how well it works.
Post a Comment